Go up to the Tutorials table of contents page
macOS only: ensure you have Homebrew installed and then install Doxygen
and Graphviz using brew install doxygen graphviz.
When writing large amounts of code, it is important to document it, both for your understanding later, as well as for other people’s understanding (such as the graders). So far, all of our documentation has been via regular comments. However, there exist a number of documentation tools that allow us to do a lot more with our comments. Consider the Java SDK source code. If you look at the code itself, there are a lot of comments with special “tags” in the source code. A tag is a special command that denotes the comment is about some specific aspect, such as the parameter type or return value. The source code is then run through a program called javadoc (which comes with the Java SDK), and the full online HTML documentation pages that we are familiar with are then created.
Javadoc is great for Java code, but does not work for C++ code. Thus, we are going to use a program called doxygen, which works on a dozen different languages, including C++. A function might be commented as follows:
/**
 * @brief Computes the average of the two passed values.
 *
 * This function computes the average using the standard accepted
 * formula for doing so.
 *
 * @return The average of the two passed values.
 * @param x The first value to average.
 * @param y The second value to average.
 * @todo Need to write acceptance tests for this function
 */

double average(double x, double y) {
    return (x + y) / 2.0;
}
This is much more documentation than is probably necessary for the
average() function, but the point is to show the
functionality of doxygen. Note that five of the lines have tags, such as
@return, which means that the following comment is
specifically about the return value. Some tags, such as the
@param tag, require a parameter.
Save the above code as a file called average.cpp (src).
There is also a main() function in that file that reads in
two doubles, calls average(), and prints out the result;
that function is not commented.
We need to tell doxygen what files to process, and a large number of
other options. These are all kept in a file called
Doxyfile. To generate that file, run doxygen
-g in the same directory as the files you want to document (the
-g means “generate”). This will create a Doxyfile with the
default options. We will need to edit it to set a few things. The line
numbers provided are for version 1.8.6 of Doxygen; if you are using a
different version, then your line numbers may vary.
GENERATE_LATEX option (line 1,543): change
YES to NO. We want HTML output (which is
already set to yes), but we don’t want LaTeX output.EXTRACT_ALL option (line 401): set to
YES. This will cause Doxygen to create documentation for
all the members in our file, including our
average() function.OUTPUT_DIRECTORY option (line 61): set to
doc/. This will cause all the created files to be in the
doc/ sub-directory, and this is necessary for us to find your
files.PROJECT_NAME option (line 35): set to "PDR
Lab 11". This creates the appropriate title for the created
documentation.QUIET option (line 686) to
YES.We run doxygen via the doxygen command. The
configuration file you created above produces documentation in just one
form, HTML. With a modification to the configuration file (which we
won’t see here), it can produce documentation in other formats as well
(LaTeX, man pages, XML, RTF, etc).
To see the documentation you generated, go to the
doc/html directory and view
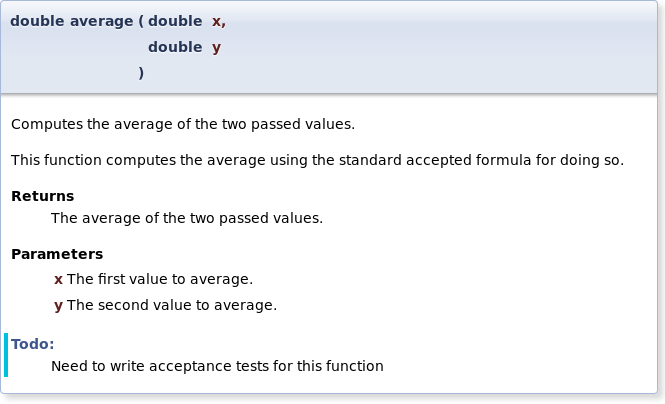
doc/html/index.html. If you look at the documentation for
this function (from the main page, follow the “Files” link on the title
bar, and then the “average.cpp” link), you will see what is below. Note
that there is more to that page than this image; what is below just
shows the extracted documentation for average().
Do you see how the tags are separated into the different parts of this comment block?
Doxygen can create call graphs for your code. We are going to change
three options to YES: HAVE_DOT (line 2,052),
CALL_GRAPH (line 2,168), and CALLER_GRAPH
(line 2,179). The first one turns on graph creation (“dot” is the
command-line for the graphviz package); the second and third turn on
specific types of graphs.
Now, run doxygen again, and view the page describe above
(the one that shows the contents of average.cpp). You will see a few new
graphs added. Keep in mind that, as the input source code (average.cpp)
was rather small, these graphs are not going to be particularly all that
large, either.
The first graph is a dependency graph:
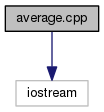
This shows what the average.cpp file depends on. Specifically, this
is what #include lines it has, which is only iostream in
this case.
The second graph is a callee graph for average():
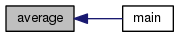
This shows that functions and methods call average() –
in this case, it’s only main().
The third graph is a caller graph for main():
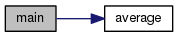
This shows the functions that main() calls – in this
case, it’s only average().
As the source code gets larger, so do the graphs. In fact, there is a
maximum limit as to how big the graphs are. Specifically, the
DOT_GRAPH_MAX_NODES option in the Doxyfile (initial value
of 50) limits how many nodes can be represented in a single graph. In
all the three examples shown above, there are only two nodes. After you
start getting toward 100 nodes, the graph starts becoming too large to
see on a screen, and its utility as a visualization tool is lost.
The doxygen manual has plenty of information on how to use doxygen. You’ll probably find the Documenting the code and Special Commands chapters to be the most useful.
Private members are not documented in Doxygen by default. To change
this, you will want to change the EXTRACT_PRIVATE flag in
Doxyfile to YES.
You may have to include all of your comments in your .h file. Whether
you have to do this depends on how you structure your code and the code
comments. If you are making changes to your doxygen comments and are not
seeing the results, try moving them to the .h file. As long as the
documentation is created when doxygen is run, we don’t
really care where your doxygen comments are in your source code.