Wireshark
Overview
We have seen multiple ways to capture network packets: we can: listen in on the wired network connection, observe the WiFi traffic, execute an in-the-middle attack using a USB Pineapple, ARP spoof, send router redirects, or just run a Scapy Python program. Now that we can observe packets, we are going to start capturing them and analyzing them.
In this assignment you will be analyzing network traffic through Wireshark. You will analyze saved pcap files, save your own pcap files, and analyze live network traffic. Wireshark is installed on the Docker images.
You will be submitting an edited version of wireshark.py (src).
Changelog
Any changes to this page will be put here for easy reference. Typo fixes and minor clarifications are not listed here. So far there aren’t any significant changes to report.
Basic Analysis
Most network analysis comes from saved pcap files. A program, such as tcpdump, will save the file, and then it is analyzed later. In this section, we will walk you through how to analyze a saved pcap file.
Your answers to the questions posed below will go in the wireshark.py (src) file.
First you have to download your pcap file to analyze. You must use your own! The URL to download it is on the Canvas landing page.
After completing this entire assignment, you would be expected to be able to find this type of information in a pcap file without the walk-through that is below.
To start this analysis, we are going to analyze a few separate network connections in the pcap file. This file has 492 packets.
- We are first going to analyze the FTP traffic. You can enter
ftpin the filter box to only show the FTP traffic (you have to hit Enter after you add or edit a filter for it to take effect). At the bottom of the screen, it says how many packets there are (492), how many are displayed (25), and what percentage the displayed is of the total packets. FTP transmits all of the credentials in plain text, which is what we are going to look at.- Question 1: what is the port number on the client (192.168.100.101) opened for this FTP connection?
- Question 2: what is the username that was used to log in?
- Question 3: what was that user’s password?
- There is a telnet session in this data as well. Enter a
telnetfilter to only show the telnet packages. But we only want what the client sends to the server, and not the server’s response. When the telnet server sends back a response, it all fits into one packet. You can see this in packet # 120, where the splash screen is displayed; the “Telnet” drop-down displays what it looks like. But when the user enters data, because the user types (relatively) very slowly, each character is sent separately. Note that the login prompt is displayed in packet 126. Next, we want to see what the client sends the server, so we enter the filtertelnet and ip.src==192.168.100.101(make sure it’s a double equals!). We know that the login prompt was sent to the client in packet 126, so the successive telnet packets (from the client to the server) are the username. Look through the successive packets and see that the username entered wasmst3k. We know the username is done being entered when a\ris sent (that’s the pressing of the Enter key).- Question 4: what is the password that mst3k entered to log in?
- Next we are going to look at the HTTP traffic. You can enter
httpin the filter box; it displays 14 packets.- Look at the first packet displayed (# 73). You can see the HTTP request in the “Hypertext Transfer Protocol” section, which is under the TCP packet information in the middle window pane.
- Question 5: what is the URL that was requested?
- While ftp had the password displayed in the “Info” column in the top window pane, HTTP puts POST information in the packet, and Wireshark does not display that in the packet list. You can see that packet 378 has POST information, as the string “POST” appears in the “Info” column.
- Question 6: what is the username used to attempt to log in?
- Question 7: what is the password used to attempt to log in?
- We also want to look at the SSH traffic. You can use that filter (
ssh) to show only the SSH packets. It may be that, in the “SSH Protocol” drop-down, that the data in each packet is encrypted, and is shown in hex. Otherwise, right-click on the “SSH Protocol”, select Copy, then “as Hex stream” to get the encrypted hex data.- Question 8: how many SSH packets are present after using the
sshfilter? - Question 9: what is the “Encrypted Packet” value for the first SSH packet in the capture? This is for the first packet that has “Encrypted packet” in the “Info” column – the packets before this are showing the key exchange.
- Question 8: how many SSH packets are present after using the
- Lastly, notice that the packets have a coloring scheme. You can see that scheme via View -> Coloring Rules. You don’t have to have these all memorized, just know that the different colors indicate some of the properties of the packets.
- Question 10: what is the background color (not the font color) of packets that are a bad TCP packet?
Advanced Analysis
Having just seen the basics of pcap analysis, we are going to look at a more advanced analysis of a pcap file. You are not expected to be able to do this analysis after completing this assignment (although if you can, great!). But you are expected to understand each step, even if you would not have come up with the various steps yourself.
Due to it’s size, the pcap file for this part is in Canvas Files, and is called wireshark_hw.pcap.
Each step indicates how many packets are displayed by the current filters – you should ensure that is the case when you enter the filters yourself.
- We can’t do much with encrypted traffic unless we have the decryption key, so we are going to eliminate the encrypted traffic: use
!tlsas the filter. This displays 10,547 packets. - We also don’t want ICMP at this point. Maybe we do want to eventually analyze ICMP (such as the ping payloads in the last assignment), but we’ll start with regular TCP/IP traffic for now. We update the filter to be
!tls and !icmp, which displays 10,282 packets. - If you scroll down the 10,282 packets, you will notice a lot of red and gray packets. Red is various errors, and gray is a TCP SYN or TCP FIN packet. Beneath that are a number of light green packets (HTTP), followed by a number of generic TCP packets (very light purple, which looks almost the same as the light blue for UDP packets).
- Let’s look at the HTTP data. And
and httpto your filter, so the full filter is now:!tls and !icmp and http, displaying 3,805 packets. - If you scroll down the displayed packets, you see a lot of packets that show “HTTP/1.1 404 Not Found”. Having that many is not typical. Let’s look through these 3,805 packets, starting with the very first one displayed.
- The first packet displayed (# 2,131) is a request for the ‘/’ URL. Nothing interesting there.
- The second packet displayed (# 2,132) is the response to the packet just mentioned in the previous bullet point. You can see the HTML response in the middle pane. It’s raw HTML, which is not so easy to read – we’ll show how to extract these files in a bit.
- The third packet displayed (# 2,133) starts showing something possibly relevant – the user-agent field is where the web browser identifies itself when making the request. But here it says “Nmap Scripting Engine”. We used nmap scripts in the Network Commands (md) assignment. So somebody is doing a scan of this web server.
- We can skim through the HTTP requests and responses, but we’ll save you the trouble and skip down to packet # 2,769. If you look at the user-agent there, it says DirBuster. DirBuster is a fuzzing tool – it tries a huge number of parts after the URL to see if anything “interesting” exists on the server. This is what is causing the 404 (not found) error messages – DirBuster is trying those URLs, and most don’t exist.
- To help narrow the display, we want to restrict the packets even more; we want to see the webserver responses. Rather than add to the filter, we are going to right click on the webserver address (172.16.40.2) in the source column, then click “Apply as Filter”, then “…and Selected”. This adds
&& (ip.src == 172.16.40.2)to the filter for us; our full filter is(!tls and !icmp and http) && (ip.src == 1172.16.40.2). Note that you can useandor&&interchangeably. - Let’s remove the 404 responses, since DirBuster did not find anything useful there. We’ll add
and not http.response.code == 404to our filter. Our full filter is:(!tls and frame.number >= 492 and !icmp and http) && (ip.src == 172.16.40.2) and not http.response.code == 404, showing 115 packets. This is a number that is much easier to look through. - We will avoid you having to scan through the packets, and point you to packet # 6,790. THis is a HTTP code of 301 (moved permanently). That HTTP response code is a redirect, and typically what a login page does – it redirects you to on a successful login. The URL is http://172.16.40.2/openemr/. OpenEMR is a medical records system.
- Let’s see if there was a login attempt to the OpenEMR system. You can use the filter
http and frame contains "openemr" and http.request.method=="POST"; this displays 13 packets. We are removing some of the filter parts – if it’s HTTP, then it’s not ICMP, for example. Looking at the first frame (7,392), it says, in the middle pane, “HTML Form URL Encoded” – meaning it was a form submission. Opening that drop-down, we see that the login attempt was admin/admin. In the “Hypertext Transfer Protocol” drop-down, toward the bottom is “Response in frame: 7885”. Double click on this, and view the HTML results. Not much happens, since that frame is not part of the current filter. So we remove the filter, and then double click on it, and packet 7,885 should appear. At the very bottom of the middle pane (in the “Hypertext… drop down”), we see “w.top.location.href = ‘/openemr/interface/login_screen.php?error=1&site=’;”, indicating an unsuccessful login. - Put our last filter back in (
http and frame contains "openemr" and http.request.method=="POST"), and take a look at the second packet (# 11,156). This was a login with admin/openemr. Looking at the response packet (# 11,165) – removing the filter first – we see that they were redirected to “http://172.16.40.2/openemr/interface/main/main_screen.php?auth=login&site=default”. A successful login! - We want to look at what the server (172.16.40.2) responded with after this point (packet # 11,156), and we are really only interested in the HTTP packets. So we use the filter
ip.src==172.16.40.2 and frame.number>11647 and http; this shows 23 packets. Although more TCP packets were needed to finish sending the large files – which we’ve filtered out – Wireshark will reassemble them for us. - Looking at the packets, the last one (# 11,906) looks interesting – it’s an application/pdf MIME type. Select File -> Export Objects -> HTTP. This means via the HTTP protocol, not necessarily an HTML page. Select the packet we are interested in (# 11,906), and click Save (not Save All, which will save many files). Enter any filename with a PDF extension, since we know it’s an application/pdf MIME type. Some private information is in that file!
Questions to answer:
- Question 11: What is the patient’s first name?
- Question 12: What is the patient’s last name?
- Question 13: What is the patient’s social security number?
Again, you are not expected to be able to do this part on your own – that requires a lot of experience analyzing network packets. You are expected to understand how each step works, though.
Live Capture
Uh-oh, it looks like there is some malware on the inner container. We don’t know much about it, so you have to figure out what is up and let us know. This file seems to send network traffic, but not much else. It’s been quarantined, and the executable is /usr/bin/run_malware, so you can just run it via run_malware; it is not running by default. You can type “quit” at any time to cause it to exit. If that file is not there, try restarting your Docker containers (docker compose down followed by docker compose up -d).
Note: this is not real malware, and it doesn’t actually do anything malicious. It does send some network data, of course – otherwise there would be no point to this part of the assignment. While you are welcome to try to use other tools to figure out what is going on, the executable has been deigned so that any other tools will not be all that useful. This part of the assignment was explicitly designed to only need Wireshark.
There are at least four different “things” going on in this program. However, you do not need to find all of them for full credit!
You will put your findings in wireshark.py (src).
Wireshark warning: when capturing live network traffic, the network packets are saved to memory. You can restart the capture via the toolbar icon (the green shark fin) – this removes from memory all the captured packets so far. If you leave it running for too long while capturing network packets, it may fill up your computer’s memory, causing slowdown or halting the system. The run_malware program creates around 1 Mb of data every 10 minutes, so it is not likely to be a problem, unless you leave it running overnight or for a very long time. But be aware that if you are on a busy network, it will fill up fast.
Important Mac host note
Mac users MUST run Wireshark on gateway, NOT on inner. The way that Mac hosts run GUIs is to send the display information over the Docker network. If you run Wireshark on inner, you will see all of your display traffic in addition to the traffic that you are trying to analyze – and there is much more display traffic. If you run Wireshark on gateway, then the display traffic goes directly to firewall (via outernet), and you can monitor gateway’s interface to inner (eth0), which will have all the run_malware traffic from inner, but none of the display traffic.
Saving pcaps
The last part of this assignment is to make your own .pcap file. You can do this through Wireshark. The intent is to save enough packets from one of the “malicious” things that the run_malware executable does. You will indicate which one in the wireshark.py (src) file.
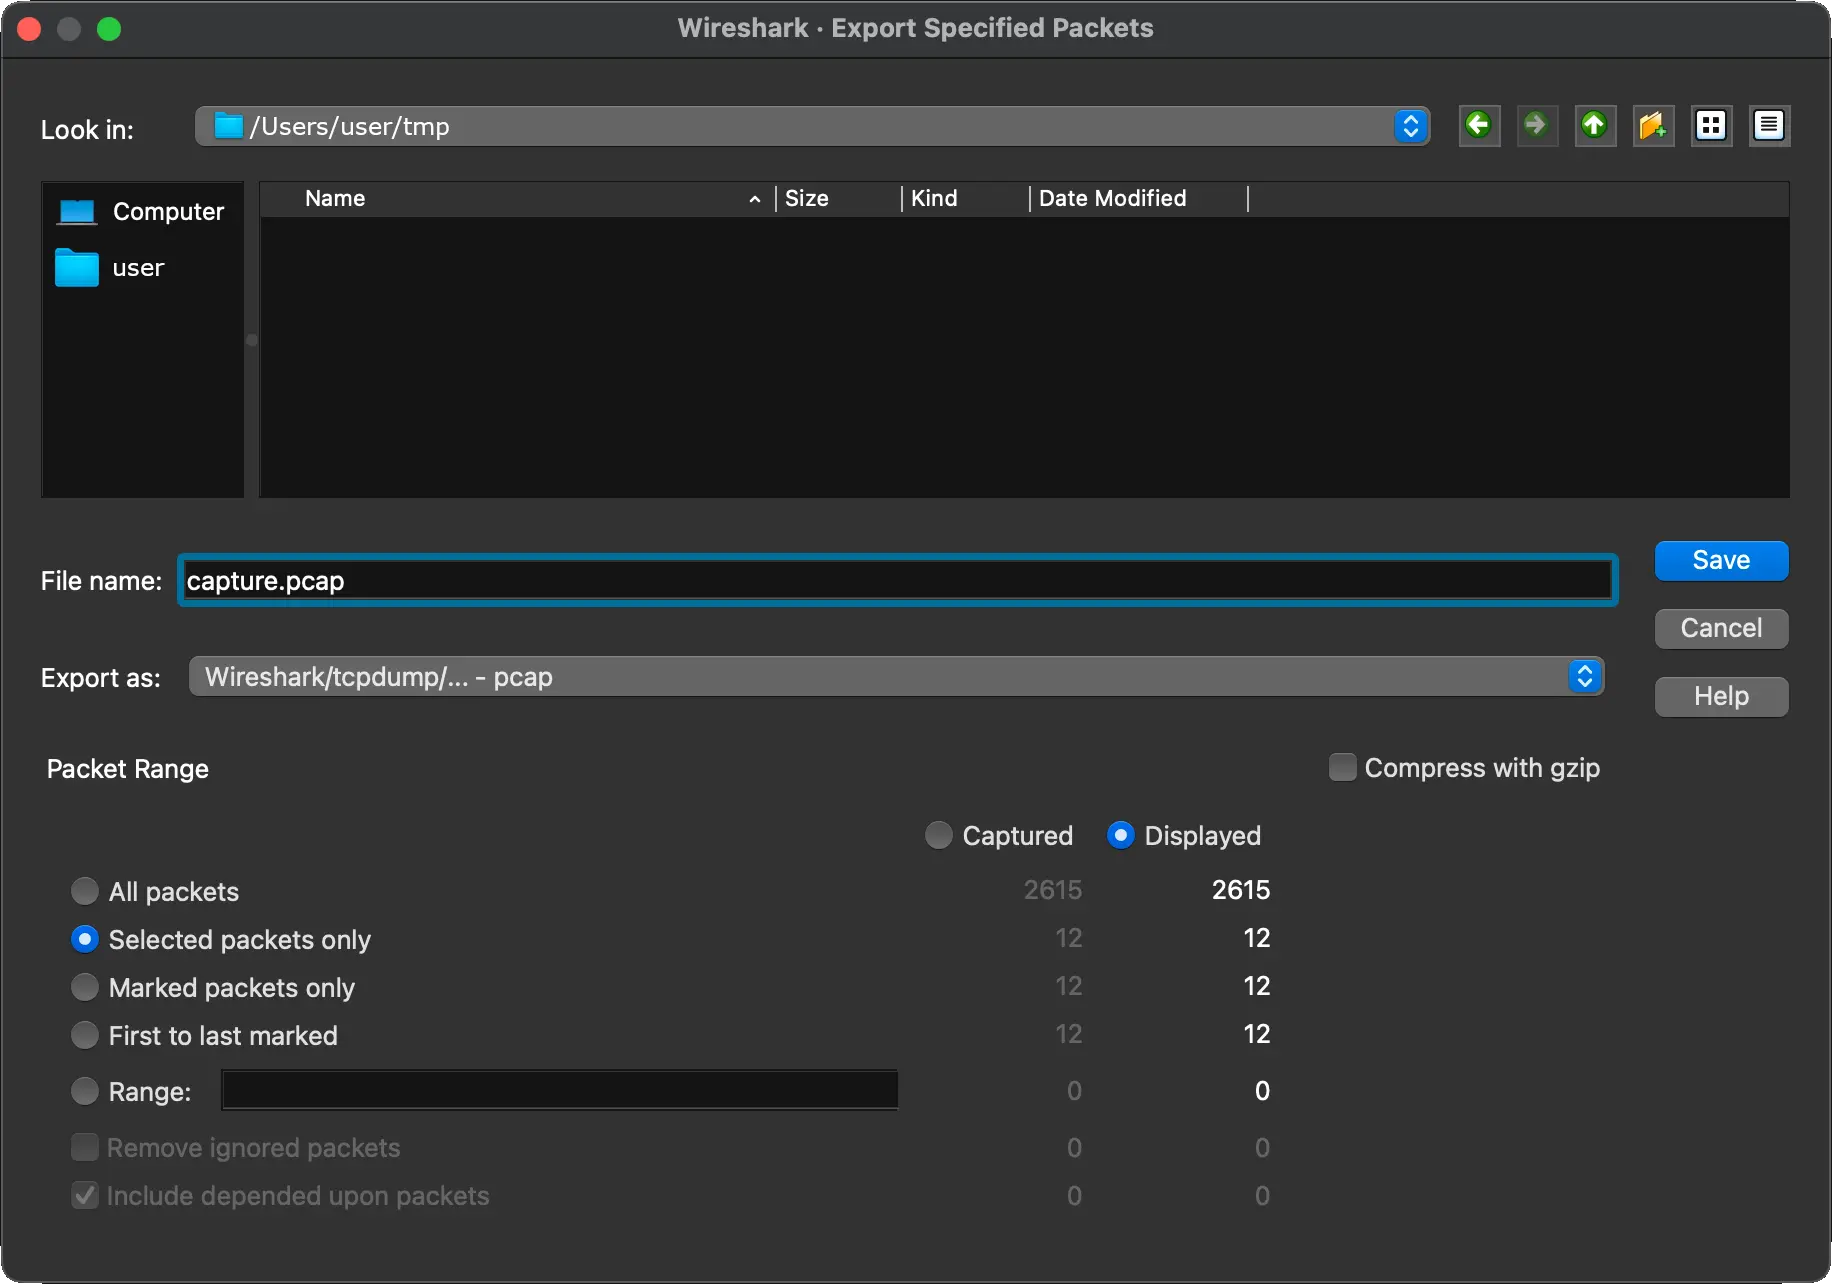
You will need to edit your pcap to only have the necessary packets. The intent is not to just save a lot of network data and submit that. There is a maximum file size allowed for this submission! To edit your pcap file, load it into Wireshark (if not already loaded). You can highlight the relevant packets, and select File -> Export Selected Packets. In the dialog box that appears, you have to toggle some of the settings at the bottom – in particular, you will want to change the packet range from “all packets” to “selected packets only”. Also, be sure to save it as a .pcap file type, not a .pcapng (which is what Wireshark defaults to). You can see these selections in the dialog box image to the right.
The capture should be saved to capture.pcap.
Submission
You will be submitting an edited version of wireshark.py (src) as well as your capture.pcap file.